Total Equipment Cost
Annual Operations and Maintenance Cost
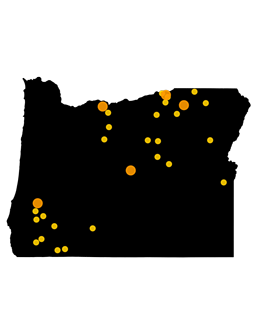
Students Affected
| Rank | School district | Total Equipment (1970-2025) | Annual O&M | # of Students Impacted | Increase in heat days from 1970–2025 (Total heat days) |
|---|---|---|---|---|---|
| 1 | Hermiston School District 8OR | 25,567,000 | 411,000 | 5,770 | 10 (40) |
| 2 | Roseburg School District 4OR | 22,736,000 | 324,000 | 5,070 | 13 (33) |
| 3 | Pendleton School District 16OR | 13,669,000 | 224,000 | 3,010 | 10 (37) |
| 4 | North Wasco School District 21OR | 12,006,000 | 190,000 | 2,690 | 10 (38) |
| 5 | Crook County School DistrictOR | 11,538,000 | 108,000 | 2,600 | 9 (32) |
| 6 | Morrow School District 1OR | 8,741,000 | 166,000 | 1,890 | 11 (38) |
| 7 | Jefferson County School District 509JOR | 8,472,000 | 114,000 | 2,510 | 11 (35) |
| 8 | Ashland School District 5OR | 7,903,000 | 106,000 | 1,690 | 12 (34) |
| 9 | Milton-Freewater School District 7OR | 7,901,000 | 122,000 | 1,770 | 10 (34) |
| 10 | Three Rivers School DistrictOR | 7,699,000 | 144,000 | 4,430 | 12 (44) |
| 11 | South Umpqua School District 19OR | 5,814,000 | 77,000 | 1,310 | 12 (33) |
| 12 | Nyssa School District 26OR | 5,539,000 | 83,000 | 1,260 | 14 (46) |
| 13 | Winston-Dillard School District 116OR | 4,831,000 | 83,000 | 1,030 | 13 (33) |
| 14 | Phoenix-Talent School District 4OR | 4,474,000 | 68,000 | 2,480 | 10 (44) |
| 15 | Umatilla School District 6OR | 4,046,000 | 54,000 | 980 | 11 (38) |
| 16 | John Day School District 3OR | 2,541,000 | 27,000 | 560 | 9 (29) |
| 17 | Klamath County School DistrictOR | 2,250,000 | 22,000 | 500 | 11 (29) |
| 18 | Stanfield School District 61OR | 2,122,000 | 35,000 | 460 | 11 (40) |
| 19 | Riddle School District 70OR | 1,772,000 | 21,000 | 400 | 13 (36) |
| 20 | Elgin School District 23OR | 1,724,000 | 17,000 | 390 | 8 (33) |
| 21 | Dufur School District 29OR | 1,720,000 | 29,000 | 330 | 16 (37) |
| 22 | Grants Pass School District 7OR | 1,555,000 | 77,000 | 6,070 | 10 (49) |
| 23 | Echo School District 5OR | 1,497,000 | 33,000 | 290 | 15 (43) |
| 24 | Pilot Rock School District 2OR | 1,488,000 | 21,000 | 320 | 9 (33) |
| 25 | South Wasco County School District 1OR | 1,117,000 | 15,000 | 250 | 13 (35) |
| 26 | ODE YCEP DistrictOR | 390,000 | 7,000 | 80 | 8 (24) |
| 27 | Spray School District 1OR | 322,000 | 6,000 | 60 | 15 (41) |
| 28 | Monument School District 8OR | 260,000 | 4,000 | 50 | 14 (41) |
| 29 | Dayville School District 16JOR | 223,000 | 4,000 | 40 | 16 (45) |
| 30 | Eagle Point School District 9OR | 183,000 | 50,000 | 3,790 | 12 (49) |
| 31 | Baker School District 5JOR | 109,000 | 1,000 | 30 | 9 (30) |
| 32 | Medford School District 549OR | 0 | 138,000 | 12,080 | 12 (50) |
| 33 | Central Point School District 6OR | 0 | 61,000 | 4,780 | 13 (52) |
| 34 | Ontario School District 8OR | 0 | 26,000 | 2,350 | 11 (51) |
| 35 | Vale School District 84OR | 0 | 9,000 | 910 | 11 (48) |
| 36 | Rogue River School District 35OR | 0 | 9,000 | 810 | 12 (47) |
| 37 | Adrian School District 61OR | 0 | 6,000 | 300 | 12 (48) |
| 38 | Arock School District 81OR | 0 | 0 | 20 | 17 (50) |
| 39 | Falls City School District 57OR | 0 | 0 | 0 | 9 (23) |
| 40 | Oregon Department of EducationOR | 0 | 0 | 0 | 11 (27) |
| 41 | Gervais School District 1OR | 0 | 0 | 0 | 8 (23) |
| 42 | Yamhill-Carlton School District 1OR | 0 | 0 | 0 | 9 (26) |
| 43 | Harrisburg School District 7JOR | 0 | 0 | 0 | 10 (25) |
| 44 | North Santiam School District 29JOR | 0 | 0 | 0 | 8 (22) |
| 45 | Hillsboro School District 1JOR | 0 | 0 | 0 | 9 (26) |
| 46 | Knappa School District 4OR | 0 | 0 | 0 | 1 (4) |
| 47 | Myrtle Point School District 41OR | 0 | 0 | 0 | 5 (8) |
| 48 | Adel School District 21OR | 0 | 0 | 0 | 17 (40) |
| 49 | Greater Albany School District 8JOR | 0 | 0 | 0 | 10 (24) |
| 50 | Amity School District 4JOR | 0 | 0 | 0 | 8 (27) |
| 51 | Ashwood School District 8OR | 0 | 0 | 0 | 10 (27) |
| 52 | Astoria School District 1OR | 0 | 0 | 0 | 0 (3) |
| 53 | Athena-Weston School District 29JOR | 0 | 0 | 0 | 9 (28) |
| 54 | Bandon School District 54OR | 0 | 0 | 0 | 0 (1) |
| 55 | Banks School District 13OR | 0 | 0 | 0 | 9 (27) |
| 56 | Beaverton School District 48JOR | 0 | 0 | 0 | 8 (22) |
| 57 | Bend-La Pine Administrative School District 1OR | 0 | 0 | 0 | 8 (22) |
| 58 | Bethel School District 52OR | 0 | 0 | 0 | 9 (24) |
| 59 | Black Butte School District 41OR | 0 | 0 | 0 | 12 (24) |
| 60 | Brookings-Harbor School District 17OR | 0 | 0 | 0 | -1 (4) |
| 61 | Harney County School District 3OR | 0 | 0 | 0 | 11 (28) |
| 62 | Canby School District 86OR | 0 | 0 | 0 | 9 (25) |
| 63 | Cascade School District 5OR | 0 | 0 | 0 | 8 (23) |
| 64 | Centennial School District 28JOR | 0 | 0 | 0 | 9 (21) |
| 65 | Central School District 13JOR | 0 | 0 | 0 | 9 (26) |
| 66 | Central Linn School District 552OR | 0 | 0 | 0 | 11 (24) |
| 67 | Clatskanie School District 6JOR | 0 | 0 | 0 | 5 (10) |
| 68 | Rainier School District 13OR | 0 | 0 | 0 | 7 (14) |
| 69 | Colton School District 53OR | 0 | 0 | 0 | 7 (17) |
| 70 | Condon School District 25JOR | 0 | 0 | 0 | 5 (20) |
| 71 | Coquille School District 8OR | 0 | 0 | 0 | 2 (5) |
| 72 | Corbett School District 39OR | 0 | 0 | 0 | 12 (25) |
| 73 | Corvallis School District 509JOR | 0 | 0 | 0 | 9 (23) |
| 74 | Harney County School District 4OR | 0 | 0 | 0 | 15 (34) |
| 75 | Harney County Union High School District 1JOR | 0 | 0 | 0 | 15 (34) |
| 76 | Coos Bay School District 9OR | 0 | 0 | 0 | 0 (1) |
| 77 | Creswell School District 40OR | 0 | 0 | 0 | 11 (26) |
| 78 | Crow-Applegate-Lorane Sd 66OR | 0 | 0 | 0 | 11 (23) |
| 79 | Culver School District 4OR | 0 | 0 | 0 | 10 (29) |
| 80 | Dallas School District 2OR | 0 | 0 | 0 | 7 (25) |
| 81 | David Douglas School District 40OR | 0 | 0 | 0 | 8 (20) |
| 82 | Dayton School District 8OR | 0 | 0 | 0 | 9 (28) |
| 83 | Diamond School District 7OR | 0 | 0 | 0 | 15 (33) |
| 84 | Double O School District 28OR | 0 | 0 | 0 | 16 (37) |
| 85 | North Douglas School District 22OR | 0 | 0 | 0 | 9 (30) |
| 86 | Drewsey School District 13OR | 0 | 0 | 0 | 15 (41) |
| 87 | Estacada School District 108OR | 0 | 0 | 0 | 7 (19) |
| 88 | Eugene School District 4JOR | 0 | 0 | 0 | 10 (24) |
| 89 | Fern Ridge School District 28JOR | 0 | 0 | 0 | 12 (25) |
| 90 | South Harney School District 33OR | 0 | 0 | 0 | 18 (48) |
| 91 | Enterprise School District 21OR | 0 | 0 | 0 | 10 (22) |
| 92 | Siuslaw School District 97JOR | 0 | 0 | 0 | 1 (6) |
| 93 | Forest Grove School District 15OR | 0 | 0 | 0 | 9 (28) |
| 94 | Frenchglen School District 16OR | 0 | 0 | 0 | 15 (39) |
| 95 | Gaston School District 511JOR | 0 | 0 | 0 | 8 (23) |
| 96 | Gladstone School District 115OR | 0 | 0 | 0 | 9 (26) |
| 97 | Glendale School District 77OR | 0 | 0 | 0 | 12 (34) |
| 98 | Glide School District 12OR | 0 | 0 | 0 | 12 (30) |
| 99 | Central Curry School District 1OR | 0 | 0 | 0 | 0 (1) |
| 100 | Gresham-Barlow School District 1JOR | 0 | 0 | 0 | 9 (22) |
| Rank | School district | Total Equipment (1970-2025) | Annual O&M | # of Students Impacted | Increase in heat days from 1970–2025 (Total heat days) |
|---|---|---|---|---|---|
| 1 | Hermiston School District 8OR | 25,567,000 | 411,000 | 5,770 | 10 (40) |
| 2 | Roseburg School District 4OR | 22,736,000 | 324,000 | 5,070 | 13 (33) |
| 3 | Pendleton School District 16OR | 13,669,000 | 224,000 | 3,010 | 10 (37) |
| 4 | North Wasco School District 21OR | 12,006,000 | 190,000 | 2,690 | 10 (38) |
| 5 | Morrow School District 1OR | 8,741,000 | 166,000 | 1,890 | 11 (38) |
| 6 | Three Rivers School DistrictOR | 7,699,000 | 144,000 | 4,430 | 12 (44) |
| 7 | Medford School District 549OR | 0 | 138,000 | 12,080 | 12 (50) |
| 8 | Milton-Freewater School District 7OR | 7,901,000 | 122,000 | 1,770 | 10 (34) |
| 9 | Jefferson County School District 509JOR | 8,472,000 | 114,000 | 2,510 | 11 (35) |
| 10 | Crook County School DistrictOR | 11,538,000 | 108,000 | 2,600 | 9 (32) |
| 11 | Ashland School District 5OR | 7,903,000 | 106,000 | 1,690 | 12 (34) |
| 12 | Nyssa School District 26OR | 5,539,000 | 83,000 | 1,260 | 14 (46) |
| 13 | Winston-Dillard School District 116OR | 4,831,000 | 83,000 | 1,030 | 13 (33) |
| 14 | Grants Pass School District 7OR | 1,555,000 | 77,000 | 6,070 | 10 (49) |
| 15 | South Umpqua School District 19OR | 5,814,000 | 77,000 | 1,310 | 12 (33) |
| 16 | Phoenix-Talent School District 4OR | 4,474,000 | 68,000 | 2,480 | 10 (44) |
| 17 | Central Point School District 6OR | 0 | 61,000 | 4,780 | 13 (52) |
| 18 | Umatilla School District 6OR | 4,046,000 | 54,000 | 980 | 11 (38) |
| 19 | Eagle Point School District 9OR | 183,000 | 50,000 | 3,790 | 12 (49) |
| 20 | Stanfield School District 61OR | 2,122,000 | 35,000 | 460 | 11 (40) |
| 21 | Echo School District 5OR | 1,497,000 | 33,000 | 290 | 15 (43) |
| 22 | Dufur School District 29OR | 1,720,000 | 29,000 | 330 | 16 (37) |
| 23 | John Day School District 3OR | 2,541,000 | 27,000 | 560 | 9 (29) |
| 24 | Ontario School District 8OR | 0 | 26,000 | 2,350 | 11 (51) |
| 25 | Klamath County School DistrictOR | 2,250,000 | 22,000 | 500 | 11 (29) |
| 26 | Riddle School District 70OR | 1,772,000 | 21,000 | 400 | 13 (36) |
| 27 | Pilot Rock School District 2OR | 1,488,000 | 21,000 | 320 | 9 (33) |
| 28 | Elgin School District 23OR | 1,724,000 | 17,000 | 390 | 8 (33) |
| 29 | South Wasco County School District 1OR | 1,117,000 | 15,000 | 250 | 13 (35) |
| 30 | Vale School District 84OR | 0 | 9,000 | 910 | 11 (48) |
| 31 | Rogue River School District 35OR | 0 | 9,000 | 810 | 12 (47) |
| 32 | ODE YCEP DistrictOR | 390,000 | 7,000 | 80 | 8 (24) |
| 33 | Spray School District 1OR | 322,000 | 6,000 | 60 | 15 (41) |
| 34 | Adrian School District 61OR | 0 | 6,000 | 300 | 12 (48) |
| 35 | Monument School District 8OR | 260,000 | 4,000 | 50 | 14 (41) |
| 36 | Dayville School District 16JOR | 223,000 | 4,000 | 40 | 16 (45) |
| 37 | Baker School District 5JOR | 109,000 | 1,000 | 30 | 9 (30) |
| 38 | Arock School District 81OR | 0 | 0 | 20 | 17 (50) |
| 39 | Falls City School District 57OR | 0 | 0 | 0 | 9 (23) |
| 40 | Oregon Department of EducationOR | 0 | 0 | 0 | 11 (27) |
| 41 | Gervais School District 1OR | 0 | 0 | 0 | 8 (23) |
| 42 | Yamhill-Carlton School District 1OR | 0 | 0 | 0 | 9 (26) |
| 43 | Harrisburg School District 7JOR | 0 | 0 | 0 | 10 (25) |
| 44 | North Santiam School District 29JOR | 0 | 0 | 0 | 8 (22) |
| 45 | Hillsboro School District 1JOR | 0 | 0 | 0 | 9 (26) |
| 46 | Knappa School District 4OR | 0 | 0 | 0 | 1 (4) |
| 47 | Myrtle Point School District 41OR | 0 | 0 | 0 | 5 (8) |
| 48 | Adel School District 21OR | 0 | 0 | 0 | 17 (40) |
| 49 | Greater Albany School District 8JOR | 0 | 0 | 0 | 10 (24) |
| 50 | Amity School District 4JOR | 0 | 0 | 0 | 8 (27) |
| 51 | Ashwood School District 8OR | 0 | 0 | 0 | 10 (27) |
| 52 | Astoria School District 1OR | 0 | 0 | 0 | 0 (3) |
| 53 | Athena-Weston School District 29JOR | 0 | 0 | 0 | 9 (28) |
| 54 | Bandon School District 54OR | 0 | 0 | 0 | 0 (1) |
| 55 | Banks School District 13OR | 0 | 0 | 0 | 9 (27) |
| 56 | Beaverton School District 48JOR | 0 | 0 | 0 | 8 (22) |
| 57 | Bend-La Pine Administrative School District 1OR | 0 | 0 | 0 | 8 (22) |
| 58 | Bethel School District 52OR | 0 | 0 | 0 | 9 (24) |
| 59 | Black Butte School District 41OR | 0 | 0 | 0 | 12 (24) |
| 60 | Brookings-Harbor School District 17OR | 0 | 0 | 0 | -1 (4) |
| 61 | Harney County School District 3OR | 0 | 0 | 0 | 11 (28) |
| 62 | Canby School District 86OR | 0 | 0 | 0 | 9 (25) |
| 63 | Cascade School District 5OR | 0 | 0 | 0 | 8 (23) |
| 64 | Centennial School District 28JOR | 0 | 0 | 0 | 9 (21) |
| 65 | Central School District 13JOR | 0 | 0 | 0 | 9 (26) |
| 66 | Central Linn School District 552OR | 0 | 0 | 0 | 11 (24) |
| 67 | Clatskanie School District 6JOR | 0 | 0 | 0 | 5 (10) |
| 68 | Rainier School District 13OR | 0 | 0 | 0 | 7 (14) |
| 69 | Colton School District 53OR | 0 | 0 | 0 | 7 (17) |
| 70 | Condon School District 25JOR | 0 | 0 | 0 | 5 (20) |
| 71 | Coquille School District 8OR | 0 | 0 | 0 | 2 (5) |
| 72 | Corbett School District 39OR | 0 | 0 | 0 | 12 (25) |
| 73 | Corvallis School District 509JOR | 0 | 0 | 0 | 9 (23) |
| 74 | Harney County School District 4OR | 0 | 0 | 0 | 15 (34) |
| 75 | Harney County Union High School District 1JOR | 0 | 0 | 0 | 15 (34) |
| 76 | Coos Bay School District 9OR | 0 | 0 | 0 | 0 (1) |
| 77 | Creswell School District 40OR | 0 | 0 | 0 | 11 (26) |
| 78 | Crow-Applegate-Lorane Sd 66OR | 0 | 0 | 0 | 11 (23) |
| 79 | Culver School District 4OR | 0 | 0 | 0 | 10 (29) |
| 80 | Dallas School District 2OR | 0 | 0 | 0 | 7 (25) |
| 81 | David Douglas School District 40OR | 0 | 0 | 0 | 8 (20) |
| 82 | Dayton School District 8OR | 0 | 0 | 0 | 9 (28) |
| 83 | Diamond School District 7OR | 0 | 0 | 0 | 15 (33) |
| 84 | Double O School District 28OR | 0 | 0 | 0 | 16 (37) |
| 85 | North Douglas School District 22OR | 0 | 0 | 0 | 9 (30) |
| 86 | Drewsey School District 13OR | 0 | 0 | 0 | 15 (41) |
| 87 | Estacada School District 108OR | 0 | 0 | 0 | 7 (19) |
| 88 | Eugene School District 4JOR | 0 | 0 | 0 | 10 (24) |
| 89 | Fern Ridge School District 28JOR | 0 | 0 | 0 | 12 (25) |
| 90 | South Harney School District 33OR | 0 | 0 | 0 | 18 (48) |
| 91 | Enterprise School District 21OR | 0 | 0 | 0 | 10 (22) |
| 92 | Siuslaw School District 97JOR | 0 | 0 | 0 | 1 (6) |
| 93 | Forest Grove School District 15OR | 0 | 0 | 0 | 9 (28) |
| 94 | Frenchglen School District 16OR | 0 | 0 | 0 | 15 (39) |
| 95 | Gaston School District 511JOR | 0 | 0 | 0 | 8 (23) |
| 96 | Gladstone School District 115OR | 0 | 0 | 0 | 9 (26) |
| 97 | Glendale School District 77OR | 0 | 0 | 0 | 12 (34) |
| 98 | Glide School District 12OR | 0 | 0 | 0 | 12 (30) |
| 99 | Central Curry School District 1OR | 0 | 0 | 0 | 0 (1) |
| 100 | Gresham-Barlow School District 1JOR | 0 | 0 | 0 | 9 (22) |
Baltimore City schools suffer from outdated infrastructure, mold, lead contamination, and a lack of funding that has prevented many schools from installing both heating equipment and air conditioning — especially in its lower-income communities and communities of color.
Read the Profile