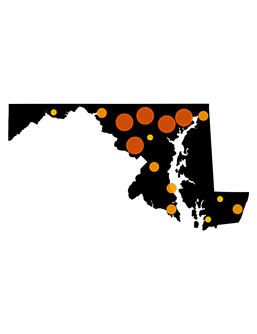

Total Equipment Cost
Annual Operations and Maintenance Cost
Students Affected
| Rank | School district | Total Equipment (1970-2025) | Annual O&M | # of Students Impacted | Increase in heat days from 1970–2025 (Total heat days) |
|---|---|---|---|---|---|
| 1 | Montgomery County Public SchoolsMD | 172,402,000 | 6,475,000 | 163,190 | 14 (49) |
| 2 | Baltimore County Public SchoolsMD | 113,130,000 | 4,292,000 | 112,000 | 15 (49) |
| 3 | Harford County Public SchoolsMD | 110,545,000 | 2,973,000 | 36,750 | 17 (46) |
| 4 | Carroll County Public SchoolsMD | 104,283,000 | 2,469,000 | 25,030 | 16 (43) |
| 5 | Frederick County Public SchoolsMD | 104,235,000 | 2,844,000 | 41,670 | 18 (48) |
| 6 | Prince George's County Public SchoolsMD | 47,895,000 | 3,330,000 | 125,510 | 16 (52) |
| 7 | Cecil County Public SchoolsMD | 37,222,000 | 1,008,000 | 15,310 | 15 (45) |
| 8 | Washington County Public SchoolsMD | 30,320,000 | 1,034,000 | 21,920 | 15 (48) |
| 9 | Worcester County Public SchoolsMD | 21,989,000 | 650,000 | 6,810 | 15 (47) |
| 10 | Calvert County Public SchoolsMD | 12,325,000 | 594,000 | 15,930 | 14 (49) |
| 11 | St. Marys County Public SchoolsMD | 12,285,000 | 534,000 | 18,180 | 15 (49) |
| 12 | Somerset County Public SchoolsMD | 3,924,000 | 147,000 | 3,500 | 16 (49) |
| 13 | Wicomico County Public SchoolsMD | 2,854,000 | 346,000 | 14,870 | 16 (51) |
| 14 | Allegany County Public SchoolsMD | 1,702,000 | 102,000 | 5,440 | 12 (41) |
| 15 | Howard County Public SchoolsMD | 1,633,000 | 1,158,000 | 57,780 | 15 (49) |
| 16 | Anne Arundel County Public SchoolsMD | 0 | 1,659,000 | 82,560 | 15 (51) |
| 17 | Baltimore City Public SchoolsMD | 0 | 1,401,000 | 56,860 | 15 (50) |
| 18 | Charles County Public SchoolsMD | 0 | 535,000 | 27,020 | 13 (53) |
| 19 | Queen Annes County Public SchoolsMD | 0 | 160,000 | 7,750 | 15 (50) |
| 20 | Caroline County Public SchoolsMD | 0 | 106,000 | 5,830 | 14 (51) |
| 21 | Dorchester County Public SchoolsMD | 0 | 97,000 | 4,790 | 16 (51) |
| 22 | Talbot County Public SchoolsMD | 0 | 91,000 | 4,670 | 14 (51) |
| 23 | Kent County Public SchoolsMD | 0 | 37,000 | 1,910 | 15 (48) |
| 24 | SEED School of MarylandMD | 0 | 12,000 | 400 | 20 (55) |
| 25 | Garrett County Public SchoolsMD | 0 | 0 | 0 | 11 (21) |
| Rank | School district | Total Equipment (1970-2025) | Annual O&M | # of Students Impacted | Increase in heat days from 1970–2025 (Total heat days) |
|---|---|---|---|---|---|
| 1 | Montgomery County Public SchoolsMD | 172,402,000 | 6,475,000 | 163,190 | 14 (49) |
| 2 | Baltimore County Public SchoolsMD | 113,130,000 | 4,292,000 | 112,000 | 15 (49) |
| 3 | Prince George's County Public SchoolsMD | 47,895,000 | 3,330,000 | 125,510 | 16 (52) |
| 4 | Harford County Public SchoolsMD | 110,545,000 | 2,973,000 | 36,750 | 17 (46) |
| 5 | Frederick County Public SchoolsMD | 104,235,000 | 2,844,000 | 41,670 | 18 (48) |
| 6 | Carroll County Public SchoolsMD | 104,283,000 | 2,469,000 | 25,030 | 16 (43) |
| 7 | Anne Arundel County Public SchoolsMD | 0 | 1,659,000 | 82,560 | 15 (51) |
| 8 | Baltimore City Public SchoolsMD | 0 | 1,401,000 | 56,860 | 15 (50) |
| 9 | Howard County Public SchoolsMD | 1,633,000 | 1,158,000 | 57,780 | 15 (49) |
| 10 | Washington County Public SchoolsMD | 30,320,000 | 1,034,000 | 21,920 | 15 (48) |
| 11 | Cecil County Public SchoolsMD | 37,222,000 | 1,008,000 | 15,310 | 15 (45) |
| 12 | Worcester County Public SchoolsMD | 21,989,000 | 650,000 | 6,810 | 15 (47) |
| 13 | Calvert County Public SchoolsMD | 12,325,000 | 594,000 | 15,930 | 14 (49) |
| 14 | Charles County Public SchoolsMD | 0 | 535,000 | 27,020 | 13 (53) |
| 15 | St. Marys County Public SchoolsMD | 12,285,000 | 534,000 | 18,180 | 15 (49) |
| 16 | Wicomico County Public SchoolsMD | 2,854,000 | 346,000 | 14,870 | 16 (51) |
| 17 | Queen Annes County Public SchoolsMD | 0 | 160,000 | 7,750 | 15 (50) |
| 18 | Somerset County Public SchoolsMD | 3,924,000 | 147,000 | 3,500 | 16 (49) |
| 19 | Caroline County Public SchoolsMD | 0 | 106,000 | 5,830 | 14 (51) |
| 20 | Allegany County Public SchoolsMD | 1,702,000 | 102,000 | 5,440 | 12 (41) |
| 21 | Dorchester County Public SchoolsMD | 0 | 97,000 | 4,790 | 16 (51) |
| 22 | Talbot County Public SchoolsMD | 0 | 91,000 | 4,670 | 14 (51) |
| 23 | Kent County Public SchoolsMD | 0 | 37,000 | 1,910 | 15 (48) |
| 24 | SEED School of MarylandMD | 0 | 12,000 | 400 | 20 (55) |
| 25 | Garrett County Public SchoolsMD | 0 | 0 | 0 | 11 (21) |
Baltimore City schools suffer from outdated infrastructure, mold, lead contamination, and a lack of funding that has prevented many schools from installing both heating equipment and air conditioning — especially in its lower-income communities and communities of color.
Read the Profile